Introduction: Clearing the Confusion
Microsoft Fabric vs Power BI – aren’t they both Microsoft products? Why would the same company launch two tools that seemingly overlap? It’s a fair question for any business leader trying to streamline their data analytics stack. But the truth is, these two platforms serve very different – yet highly complementary – purposes. Understanding their core differences and how they work together can help you make the best decision for your business.
With more than 25,000 global organizations, including 67% of Fortune 500 companies, already using Microsoft Fabric, and Power BI trusted by 97% of those same enterprises, both platforms are transforming enterprise intelligence. This blog will guide you through each platform’s capabilities, use cases, and how they integrate—so you’re not just picking the right tool, but also future-proofing your data strategy.
What Is Microsoft Fabric?
Microsoft Fabric is an advanced AI-driven, cloud-native platform designed to unify all your enterprise data needs. It centralizes capabilities like data engineering, real-time analytics, data warehousing, and business intelligence into a single solution. Fabric connects tools like Azure Synapse, Data Factory, Power BI, and Azure Machine Learning into one integrated experience.
It’s a game-changer for businesses that require real-time, enterprise-wide data analysis and predictive modeling at scale. From ingesting data to building dashboards, Fabric helps teams eliminate data silos and create a fluid analytics experience.
Want to know how this fits in with cloud transformation? Read more about how cloud ERP can transform small business growth in 2025.
What Is Power BI?
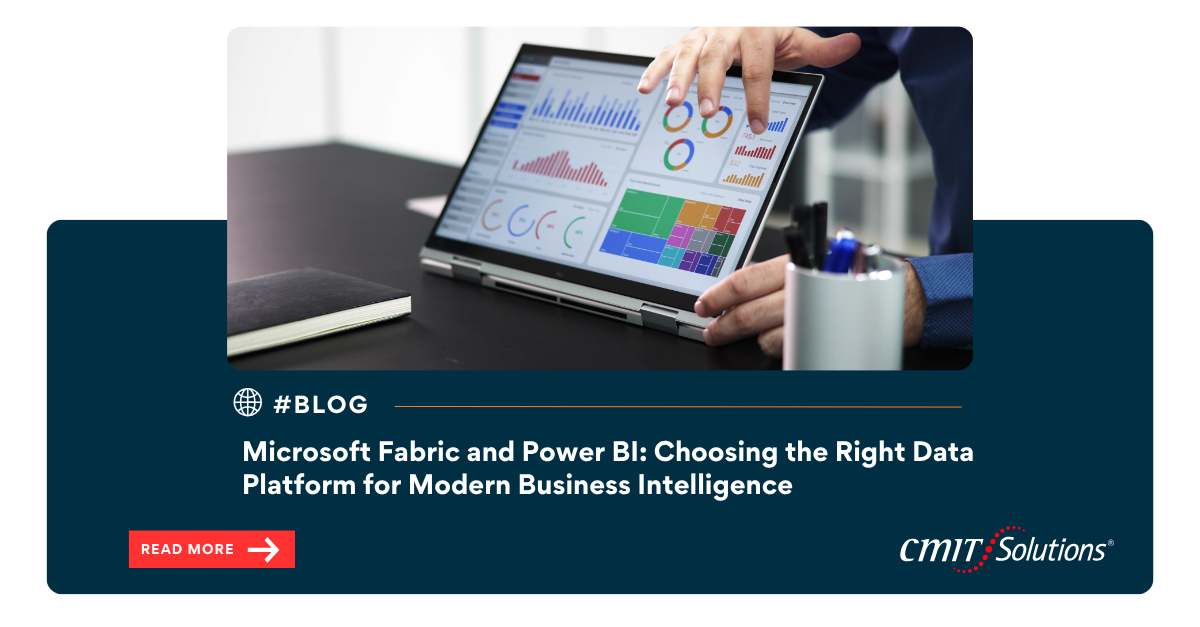
Power BI, also developed by Microsoft, is a leading self-service business intelligence (BI) tool. It’s designed for data visualization, reporting, and easy data interpretation. Business users can build dashboards using drag-and-drop tools, transforming complex data into actionable insights in real time.
With Power BI, teams can create department-specific dashboards—from sales and finance to marketing—without needing IT assistance. It integrates seamlessly with Excel, SQL Server, Azure, and other Microsoft services.
Explore its advantages in report generation by reviewing our breakdown on why CMIT Solutions of Oak Park, Hinsdale & Oak Brook offers the best unified communications for your business.
Core Features of Microsoft Fabric
- Unified Platform: Consolidates analytics, data science, business intelligence, and more
- AI-Powered Copilot: Integrated AI features such as Microsoft Copilot are pre-enabled to assist data scientists and analysts
- OneLake Storage: All data is housed in OneLake, Microsoft’s version of a centralized data lake
- Security and Compliance: Built-in governance and compliance aligned with enterprise standards
- Real-Time Analytics: Ideal for live data sources, IoT sensors, and on-the-fly decision making
Looking for ways to enhance data governance in Fabric? Here’s how data observability ensures real-time data reliability.
Core Features of Power BI
- User-Friendly Interface: Easy to build custom dashboards with drag-and-drop functionality
- Python-Based Visuals: Use Python for custom data visualizations
- Data Compression: Handles large datasets using advanced compression algorithms
- Cloud & On-Prem Access: Access reports from desktop, mobile, or cloud
- AI Insights: Predictive analytics and quick insights for easier data exploration
Power BI’s integration with collaboration tools like Teams makes it a top choice. To see how collaboration boosts remote efficiency, explore our post on navigating hybrid work with managed network solutions.
Microsoft Fabric vs Power BI: Understanding the Distinctions
Microsoft Fabric is a full-scale analytics platform that supports data engineering, AI, and business intelligence all within a single ecosystem. It’s ideal for complex, enterprise-level data management.
Power BI, on the other hand, is focused on enabling end-users to generate actionable insights through easy-to-use reports and dashboards. It supports lightweight to medium data workloads and is best suited for quick analytics tasks.
Looking to dive deeper into the role of AI across platforms? Check out AI governance frameworks.
When to Use Microsoft Fabric
- Enterprise-Wide Data Lake Architecture: When you want to integrate every data-related workload into one unified environment.
- Real-Time Analytics: Need to make immediate decisions from live streams of data.
- AI & ML Workflows: Requires complex models using data from multiple sources.
- Cross-Functional Data Collaboration: Involves engineers, analysts, and scientists working together.
- Complex Data Pipelines: Requires seamless orchestration and automation.
Want to better understand how to reduce multi-cloud chaos? See tame the cloud chaos with simplified strategies.
When to Use Power BI
- Self-Service Dashboards: Ideal for managers and teams generating their own insights.
- Departmental Reports: Perfect for marketing, sales, HR, or finance.
- Simple Data Modeling: When datasets are well-structured and ready to visualize.
- Ad-Hoc Reporting: Need quick answers to specific questions.
- Executive Summaries: Create overview dashboards for C-suite decisions.
Explore related insights on real-time visibility in our blog on how to gain full visibility and respond fast to network threats.
How They Work Together
Think of Microsoft Fabric as the operating system for enterprise analytics, while Power BI acts as the visualization engine. Fabric prepares, models, and governs the data; Power BI transforms it into consumable dashboards.
This synergy allows businesses to combine large-scale data engineering with user-driven BI in a seamless experience. The result? End-to-end insights with faster decision-making, compliance assurance, and reduced operational complexity.
It’s the future of hybrid analytics.
Pricing Comparison
- Microsoft Fabric: Priced by capacity units and workload consumption. Ideal for scaling across departments.
- Power BI: Priced per user with Pro and Premium tiers. Great for smaller teams needing quick insights.
Looking for affordable yet secure enterprise solutions? See why small businesses need managed IT for sustainable growth.
Top Business Scenarios
Microsoft Fabric Works Best For:
- Enterprises looking for integrated data lake and analytics
- Businesses relying on real-time data from IoT or transactional systems
- Companies building custom AI/ML models
Power BI Works Best For:
- Managers creating departmental dashboards
- Non-technical teams needing quick insights
- Finance, HR, and Sales reports
Want to understand how Power BI empowers end users? Check our article on understanding Digital Employee Experience (DEX).
Conclusion: Which One Should You Choose?
If your organization needs complete control over vast data operations, advanced analytics, and AI-powered decisions, Microsoft Fabric is your go-to platform. It consolidates every piece of your data puzzle into one scalable solution.
But if your primary focus is clear data visualization and intuitive dashboard creation, Power BI remains unmatched for simplicity and accessibility.
In most cases, the best solution isn’t Fabric or Power BI—it’s both. Together, they offer an unmatched combination of power, flexibility, and insight that can scale with your organization’s growth.
Still unsure what’s right for your business? It may be time for an expert consultation. Don’t forget to take an IT assessment before it’s too late.


